Visualisation with point cloud at Chalmers
3D laser scanning enables the creation of virtual representations of factories with high precision, in just a matter of hours. These virtual representations are photo-realistic point clouds which consist of millions of measurement points covering areas of the factories.
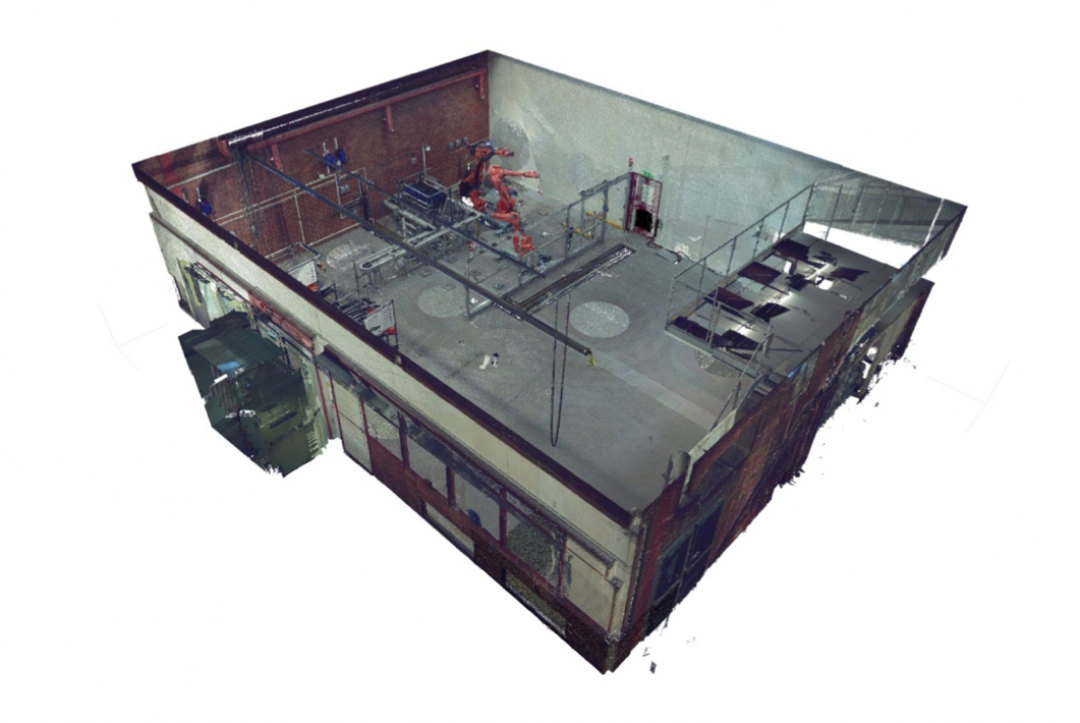
Laser beams are emitted from the 3D laser scanner and reflected onto the nearest surface. The reflection is used to measure the position of the point in relation to the 3D laser scanner. There are two measurement methods used by different 3D laser scanners: time-of-flight and phase-shift. Time-of-flight is normally best suited to distances exceeding 100 metres from the scanner, while phase-shift works better for distances less than 100 metres from the scanner. The field of application determines what type of scanner is most appropriate to use. In factories, distances under 100 metres are most common, with scanners using the phase-shift method most suitable. Each measurement represents a point on the surface of the nearest area along the direction of measurement. For each measurement, data on the point’s position in x, y and z coordinates and intensity is recorded. Ordinarily, the 3D laser scanner has a 360-degree field of vision on the horizontal axis and between 300 and 320 degrees on the vertical axis. Millions of systematic measurements in the field of vision generate a complete geometrical virtual representation in just a matter of minutes. In order to enhance visualisation, data on the colour of the surface according to the RGB scale can be added to each measurement point, which is generated by images taken by an in-built camera during each scan. The laser scanning data from multiple positions is put together through a registration process to create a complete point cloud of the factory. The point cloud can be edited and exported in accordance with the field of application.
Tags
This article is tagged with these tags. Click a tag to see all the articles with this tag.